Ready to embark on your data science journey? Data science interviews are the gateway to exciting career opportunities. To help you prepare, I’ve compiled a comprehensive list of interview questions. Whether a beginner or an experienced data scientist, these questions will challenge your understanding and sharpen your problem-solving abilities.
1. Explain the steps involved in hypothesis testing.
Hypothesis testing is a statistical method used to determine whether a claim or assumption about a population is likely to be true. It involves a series of steps to evaluate evidence and draw conclusions. Here’s a breakdown of the process:
Step 1: State the Null Hypothesis (H₀) and Alternative Hypothesis (H₁)
- Null Hypothesis (H₀): This is the default assumption, often representing the status quo or no effect. It’s what we’re trying to disprove.
- Alternative Hypothesis (H₁): This is the claim we want to test, the opposite of the null hypothesis.
Step 2: Set the Significance Level (α)
- The significance level, often denoted by alpha (α), is the probability of rejecting the null hypothesis when it’s true.
- Common values for α are 0.05 and 0.01.
Step 3: Collect Data
- Gather relevant data that will be used to test the hypothesis.
- Ensure the data is representative of the population you’re studying.
Step 4: Choose an Appropriate Test Statistic
- Select a statistical test based on the type of data and the nature of the hypothesis.
- Common tests include t-tests, z-tests, chi-square tests, and ANOVA.
Step 5: Calculate the Test Statistic
- Apply the chosen statistical test to the collected data.
- This will result in a test statistic value.
Step 6: Determine the P-value
- The p-value is the probability of obtaining a test statistic as extreme or more extreme than the one calculated, assuming the null hypothesis is true.
Step 7: Make a Decision
- Compare the p-value to the significance level (α):
- If p-value ≤ α, reject the null hypothesis (H₀) in favor of the alternative hypothesis (H₁). This suggests that the evidence supports the claim.
- If p-value > α, fail to reject the null hypothesis (H₀). This means there’s not enough evidence to conclude that the claim is true.
Step 8: Interpret the Results
- Communicate the findings of the hypothesis test.
- Explain the implications of the decision made.
Example:
Let’s say we want to test the claim that a new drug reduces blood pressure.
- H₀: The new drug does not affect blood pressure.
- H₁: The new drug reduces blood pressure.
We would collect data on blood pressure before and after administering the drug to a sample of patients. Then, we would use a t-test to compare the mean blood pressure before and after treatment. If the p-value is less than our chosen significance level (e.g., 0.05), we would reject the null hypothesis and conclude that the drug is effective in reducing blood pressure.
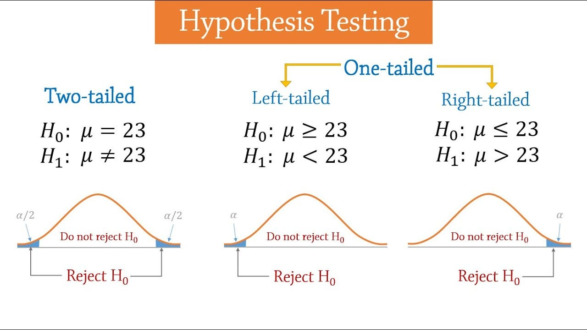
2. What is the difference between a one-tailed and a two-tailed test?
A one-tailed test evaluates the direction of the effect (greater than or less than), while a two-tailed test assesses whether there is any difference, regardless of direction. Here is the comparative discussion about the two tests.

| Feature | One-Tailed Test | Two-Tailed Test |
|---|---|---|
| Definition | A statistical test that determines the significance of a parameter in only one direction. | A statistical test that determines the significance of a parameter in either direction. |
| Alternative Hypothesis (H1) | Specifies a direction (e.g., greater than, less than) | Does not specify a direction (e.g., different from) |
| Critical Region | One-sided (either left or right tail of the distribution) | Two-sided (both tails of the distribution) |
| Significance Level (α) | Entirely allocated to one tail | Split between both tails |
| Example | Testing if a new drug decreases blood pressure | Testing if a new drug changes blood pressure (could increase or decrease) |
When to Use Which Test:
- One-tailed test: Use when you have a specific direction in mind (e.g., “Drug X is more effective than Drug Y”).
- Two-tailed test: Use when you want to know if there’s a difference in either direction (e.g., “Drug X has a different effect than Drug Y”).
Read Data Science Interview Questions: Day 1
3. What is the p-value, and how is it interpreted?
The p-value, or probability value, is a statistical measure used to assess the strength of evidence against a null hypothesis.
How is it interpreted?
Think of the p-value as the probability of observing your data (or data more extreme) if the null hypothesis were true.
- Small p-value (typically less than 0.05): This indicates that the observed data is unlikely to have occurred by chance alone, given the null hypothesis. In other words, it suggests strong evidence against the null hypothesis, leading us to reject it in favour of the alternative hypothesis.
- Large p-value (typically greater than 0.05): This suggests that the observed data is likely to have occurred by chance, even if the null hypothesis is true. In this case, we fail to reject the null hypothesis.
Key Points to Remember:
- The p-value is not the probability that the null hypothesis is true. It’s the probability of the data, assuming the null hypothesis is true.
- The significance level (α) is a predetermined threshold (often 0.05) used to decide whether to reject the null hypothesis. If the p-value is less than α, we reject the null hypothesis.
- A lower p-value indicates stronger evidence against the null hypothesis. However, it’s important to consider the practical significance of the results, not just the statistical significance.
- The p-value should be interpreted in context. A p-value of 0.01 might be significant in one study but not in another, depending on the specific research question and the sample size.
Example:
Suppose we want to test the claim that a new drug reduces blood pressure. The null hypothesis (H₀) would be that the drug has no effect, and the alternative hypothesis (H₁) would be that the drug reduces blood pressure.
We experiment and calculate a p-value of 0.02. Since 0.02 is less than the significance level of 0.05, we reject the null hypothesis. This means we have strong evidence to support the claim that the drug is effective in reducing blood pressure.
In conclusion, the p-value is a valuable tool for making statistical inferences, but it should be used in conjunction with other considerations, such as effect size and the context of the research question.
Read Data Science Interview Questions: Day 2
4. Explain Type I and Type II errors.
In hypothesis testing, two types of errors can occur:
Type I Error:
- Definition: A Type I error occurs when we incorrectly reject a true null hypothesis. In other words, we conclude that there is an effect when there isn’t one.
- Example: A medical test might incorrectly diagnose a healthy person as having a disease.
- Probability: The probability of making a Type I error is equal to the significance level (α), which is typically set at 0.05.
Type II Error:
- Definition: A Type II error occurs when we fail to reject a false null hypothesis. In other words, we conclude that there is no effect when there is one.
- Example: A medical test might fail to detect a disease in a sick person.
- Probability: The probability of making a Type II error is denoted by β.
Relationship between Type I and Type II Errors:
- There is a trade-off between Type I and Type II errors. Decreasing the probability of one type of error often increases the probability of the other.
- The power of a test is the probability of correctly rejecting a false null hypothesis (1 – β). Increasing the sample size can increase the power of a test and decrease the probability of a Type II error.
Table:
| Error Type | Definition | Probability |
|---|---|---|
| Type I | Rejecting a true null hypothesis | α (significance level) |
| Type II | Failing to reject a false null hypothesis | β (beta) |
In summary:
- Type I errors are “false positives.”
- Type II errors are “false negatives.”
- The significance level (α) controls the probability of a Type I error.
- The power of a test (1 – β) controls the probability of a Type II error.
5. What is statistical power in hypothesis testing?
Statistical power is the probability that a hypothesis test will correctly reject a false null hypothesis. In simpler terms, it’s the likelihood of detecting a true effect when it exists.
Why is statistical power important?
- Avoiding Type II Errors: A high power reduces the chance of a Type II error, which occurs when we fail to reject a false null hypothesis.
- Reliable Conclusions: A powerful test increases our confidence in the results of the study.
- Efficient Sample Size: A well-powered study can help determine the optimal sample size, minimizing the number of participants needed while maximizing the chances of detecting a true effect.
Factors Affecting Statistical Power:
- Effect Size: The larger the effect size (the difference between the null and alternative hypotheses), the higher the power.
- Significance Level (α): A higher significance level (e.g., 0.10 instead of 0.05) increases power but also increases the risk of a Type I error.
- Sample Size: A larger sample size generally increases power.
- Variability: Less variability in the data increases power.
How to Increase Statistical Power:
- Increase sample size: A larger sample size provides more information and reduces the impact of random variation.
- Increase the significance level (α): However, this increases the risk of a Type I error.
- Decrease the variability: This can be achieved through careful experimental design or by using more precise measurement instruments.
- Increase the effect size: This might involve using a stronger intervention or a more sensitive measurement tool.
By understanding and considering these factors, researchers can design studies with adequate statistical power to draw reliable conclusions.
You can always return to Briefly Today and read all the latest happenings! Stay updated, Stay aware!
Do come back for more interview questions on Data Science…

